Like a contract etched in foresight, warranties convert risk into measurable promises we can test. We’ll examine how coverage scope, duration, and remedies align with expected lifecycles, and how reliability data drives policy levers that encourage durable design and modular maintenance. Our focus is risk, economics, and transparent claim processes, all aimed at reducing total cost of ownership. There’s more to unpack about renewal, transfer, and fine print that could alter your strategy—so we should continue with careful, data-driven analysis.
Key Takeaways
- Warranties outline scope, duration, and remedies, with clear definitions of defects and exclusions to support reliability claims.
- Coverage types (electronics, mechanical, home, automotive) have typical durations and renewal/transfer rules affecting long-term value.
- Design and maintenance decisions are shaped by warranty terms, influencing material choices, serviceability, and repair paths.
- Economics of warranties link pricing, risk transfer, reserves, and total cost of ownership to durability investments.
- Measuring warranty effectiveness relies on failure trends, processing speed, customer satisfaction, and education to improve reliability.
What Are Warranties? A Foundational Quick Guide
Warranties are promises about product reliability and service coverage that give customers a clear path to recourse when issues arise. We frame warranties as structured commitments that reduce uncertainty by outlining scope, duration, and remedies. Our approach emphasizes measurable criteria: what’s covered, time limits, and required proofs. In practice, warranty terminology matters: definitions of defects, failure rates, and exclusions shape expectations and risk exposure. We assess how claim processing flows—from initial notification to verification, approval, and resolution—to quantify cycle times and bottlenecks. This helps identify operational risks and penalties for noncompliance. We encourage readers to map a warranty’s terms against real-world failure data, ensuring the coverage aligns with observed longevity and maintenance needs. Clarity in language minimizes disputes and supports durable customer trust.
Warranty Types and What They Cover

What warranty types exist, and what do they actually cover in practice? We break down how different warranties function, what they protect, and where gaps grow. Our approach is data-driven and risk-focused, so we map coverage to failure modes, not promises. We compare core categories, quantify coverage limits, and highlight where exclusions bite. This framing helps readers assess total risk, not just labeled benefits. We avoid vague generalities by tying each type to concrete scenarios, timelines, and repair paths, clarifying who bears cost when limits are reached. Understanding warranty types and coverage limits lets customers prioritize product segments, negotiate terms, and anticipate maintenance needs with greater accuracy.
- Types and core scope
- Coverage limits and caps
- Exclusions and exceptions
- Repair vs. replacement rules
- Claim processes and documentation
How Long They Last: Typical Durations by Type
We compile typical durations by type to frame risk and expectations, so you can calibrate warranties to real-world use. Our review highlights longevity benchmarks across categories and how they influence failure risk over time. By starting with these data points, we set clear criteria for evaluating long-term reliability and maintenance needs.
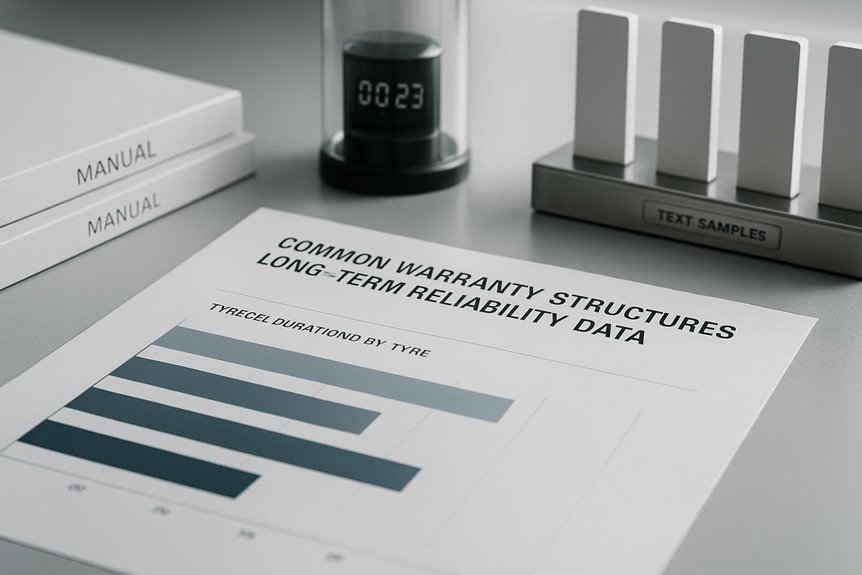
Typical Durations By Type
Determining how long warranties last depends on the type of product and its typical failure modes. We approach durations with a data-driven lens, separating categories by failure likelihood, cost of repair, and user risk. Across segments, we see clear patterns: long-lived mechanicals trend toward extended terms; electronics often stabilize with moderate coverage; consumables warrant shorter windows due to rapid wear. We frame reliability economics by balancing cost, deterrence, and replacement risk, while recognizing warranty branding signals quality and confidence. The following durations reflect typical practice and risk-adjusted expectations, not guarantees. Readers can tailor terms to align incentives with observed failure modes and channel costs.
- Electronics: 1–3 years, intermittent coverage for critical components
- Mechanical devices: 3–5 years, with extended options
- Home appliances: 2–5 years, depending on complexity
- Automotive subsystems: 3–7 years, variable by subsystem
- Industrial equipment: 1–5 years, often with maintenance stipulations
Longevity Benchmarks Across Categories
Across categories, longevity benchmarks align with failure risk and replacement costs, shaping how long things typically last. We systematically compare data across product classes to identify consistent patterns in useful life and failure modes. Our method centers on empirical lifetimes, survival curves, and failure rate trajectories, then maps these to cost-of-ownership implications. When we discuss longevity benchmarks, we emphasize how different categories exhibit distinct risk profiles and maintenance demands, informing practical expectations for consumers and manufacturers. We treat category comparisons as a framework for prioritizing durability investments and warranty design choices. The result is a disciplined view: longer lifespans aren’t universal, but predictable within each category, enabling targeted risk mitigation and clearer guidance on replacement timing for both warranties and confidence in performance.
The Economics of Warranties: Price, Risk, and Total Cost of Ownership
How do warranties shape the economics of a product? We quantify effects by linking price, risk, and total cost of ownership. We compare upfront costs, expected failure rates, and claim frequency to reveal true value. We evaluate cost risk across scenarios, translating reliability into predictable cash flows, reserve needs, and warranty duration decisions. Pricing models reflect likelihood of claims, service costs, and administrative overhead, shaping consumer choice and firm profitability. We build a framework where warranties act as risk transfer and demand signals, not just promises.
Warranties align price, risk, and value through predictive costs, cash flow, and demand signals.
- Cost risk assessment tied to failure probability and claim severity
- Pricing models balancing margin, coverage, and expected claims
- Total cost of ownership as a decision metric for buyers and sellers
- Reserve adequacy and cash-flow implications
- Sensitivity analysis across product lifecycles and channels
Turning Reliability Data Into Warranty Design Choices
We translate reliability metrics into concrete warranty design choices, focusing on what the data implies for risk and cost. Our approach maps specific metrics to strategy options, clarifying trade-offs across coverage, duration, and service levels. By outlining how data informs decisions, we enable a disciplined, evidence-based path to robust warranty structures.
Reliability Metrics Translation
Reliability metrics translate directly into actionable warranty design when we convert failure data into probabilistic models, failure modes, and time-to-failure forecasts. We align data inputs, normalize baselines, and quantify uncertainty to reveal true risk profiles. Our approach treats failures as stochastic processes, enabling robust confidence intervals for claim forecasts and service actions. We emphasize data normalization to compare across units, environments, and vintages, preventing biased decisions. This disciplined translation supports targeted coverage, redesign priorities, and cost control, while preserving customer trust. We document assumptions, validate models with holdout sets, and monitor drift over time to keep warranties aligned with observed performance. By focusing on measurable drivers, we turn insights into concrete design choices and financial planning.
- Data normalization as a foundation for cross-group comparability
- Probabilistic models that quantify time-to-failure
- Failure modes mapping to warranty actions
- Uncertainty quantification and confidence intervals
- Drift monitoring for ongoing model validity
Warranty Strategy Implications
What concrete warranty design choices follow when reliability data is translated into actionable strategy? We translate failure modes, MTBF distributions, and tail risks into policy levers that balance cost, customer trust, and long-term reliability. We define warranty durations that reflect observed failure fatigue and repairability, not hopeful averages, and we map coverage to critical components where serviceability benchmarks indicate meaningful risk reductions. We prioritize predictable costs via probabilistic reserves and tiered terms aligned with observed variances across product lines. We identify warranty gaps early, quantify impact, and close them with targeted design fixes or service extensions. Our approach emphasizes monitoring, continuous improvement, and clear documentation, ensuring stakeholders understand residual risk, while field data informs iterative refinements to minimize surprises and sustain confidence.
Renewal, Transfer, and Fine Print: Avoiding Common Traps
Do renewal terms, transfer rules, and fine print routinely become the weak link in long-term warranties? Yes, and we’ve mapped the risks we must mitigate. We quantify exposure from renewal traps and transfer pitfalls, then embed safeguards before signing. Our approach is data-driven: we compare renewal windows, notice requirements, and eligibility criteria against failure rates, documenting deviations that predict coverage gaps. We examine transfer processes for continuity, ownership changes, and third-party administration to prevent lapse risks. By codifying fine print into checklists, we reduce ambiguity and enforcement disputes, preserving value over time.
We quantify renewal and transfer risks, embedding safeguards to preserve long-term warranty value.
- Clear renewal windows and fees
- Transfer feasibility and required documentation
- Grace periods and lapse consequences
- Notification timing and methods
- Ambiguities flagged for remediation
How Warranties Shape Product Design and Maintenance Planning
We turn our focus from safeguarding warranties to how they shape the product itself and the upkeep it demands. Our analysis shows warranties drive material choices, modular design, and serviceability targets that minimize failure costs. Teams weigh risk of field failures against cost of more robust components, influencing maintenance intervals and predicted life cycles. We track long term emissions and supply chain resilience when selecting parts, balancing durability with manufacturability. This data-driven approach aligns product specs with realistic repair paths, reducing downtime and improving reliability. Below is a concise matrix to illustrate tradeoffs.
| Factor | Impact on Design | Maintenance Outcome |
|---|---|---|
| Durability Targets | Higher upfront cost but lower failure rate | Longer intervals, fewer recalls |
| Accessibility | Easier field service | Faster repairs, lower MTTR |
| Materials Choice | Supplier risk considerations | Predictable replacement cycles |
Evaluating Warranty Effectiveness for Shoppers and Businesses
How effective are warranties in practice for shoppers and businesses, and what metrics best capture that value? We assess warranty performance through measurable outcomes, not promises. We track failure incidence, claim approval rates, mean time to resolution, total cost of ownership, and net benefit to customer satisfaction. We compare supplier responses against service levels, recall responsiveness, and refurbishment success. Our approach emphasizes quality assurance processes and transparent reporting, reducing uncertainty for buyers and vendors alike. We quantify risk transfer, durability signals, and maintenance intervals to forecast reliability over time. We emphasize user education to ensure correct usage, proper documentation, and informed claims. This method yields evidence-driven insights for design, pricing, and aftercare strategies, aligning incentives across ecosystems.
- Failure incidence and trend analysis
- Claim processing speed and outcomes
- Total cost of ownership impact
- Customer satisfaction and repeat engagement
- Quality assurance and user education integration
Frequently Asked Questions
How Do Warranty Terms Differ Across Industries and Regions?
We observe that warranty terms vary by industry norms and regional regulations, with cross border coverage shaping risk, pricing, and duration, so we align our terms to local law while using standardized warranty terminology for comparability.
What Is Implied vs. Expressed Warranty Coverage?
We’re talking apples and oranges: implied coverage covers you by law, expressed coverage is explicit in writing; we assess gaps and risks, quantify likelihoods, and document protections to guarantee clear, enforceable rights for readers.
How Should Customers File a Warranty Claim Effectively?
We should file a warranty claim promptly, document damage, keep receipts, and note product packaging details; we compare clearance pricing impact and provide clear, data-driven steps to minimize risk while preserving coverage.
How Do Warranties Affect Resale Value and Asset Depreciation?
Warranties influence resale value through transferability, depreciation curves, salvage value, and coverage gaps; they affect asset depreciation via uptime guarantees, liability caps, and regional enforcement, with data on servicing networks, OEM vs aftermarket parts, and recall implications.
What Are Emerging Trends in Extended or Lifetime Warranties?
We begin with a striking stat: 70% of buyers treat extended warranties as risk mitigation. We’re seeing emerging trends in extended warranties, including usage-based pricing and longer coverage windows, supported by data-driven, risk-focused, methodical analyses for readers like you.
Conclusion
We’ve mapped how warranties transfer risk, align with lifecycles, and steer design toward durability. By tying reliability data to policy levers, we reduce total cost of ownership and clarify remedies, renewal, and transfers. For shoppers and businesses, the risk-adjusted lens reveals where coverage matters most and where exclusions bite. Our methodical view, like a calibrated compass, helps you navigate claims processes and design decisions with confidence and measurable assurance.

